```{r setup, include=FALSE} knitr::opts_chunk$set(echo = TRUE) ``` ```{r, echo=F, message=F, warning=F} library(readr) library(openintro) data(COL) data(possum) ``` # Data Basics ## Classroom survey A survey was conducted on students in an Intro to Stat course. Below are a few of the questions on the survey, and the corresponding variables the data from the responses were stored in: - *gender*: What is your gender? - *intro_extro*: Do you consider yourself introverted or extroverted? - *sleep*: How many hours do you sleep at night, on average? - *bedtime*: What time do you usually go to bed? - *countries*: How many countries have you visited? - *dread*: On a scale of $1-5$, how much do you dread being here? ## Data Matrix Data collected on students in a statistics class on a variety of variables: \begin{table}[] \begin{tabular}{cccccl} & \alert{variable} & & & & \\ & \alert{\downarrow} & & & & \\ \cline{1-5} Student & gender & intro\_extro & \dots & dread & \\ \cline{1-5} 1 & male & extrovert & \dots & 3 & \\ 2 & female & extrovert & \dots & 2 & \\ 3 & female & introvert & \dots & 4 & \alert{\leftarrow} \\ 4 & female & extrovert & \dots & 2 & \alert{observation} \\ $\vdots$ & $\vdots$ & $\vdots$ & $\vdots$& $\vdots$ & \\ 86 & male & extrovert & \dots & 3 & \\ \cline{1-5} \end{tabular} \end{table} ## Types of variables ```{r, echo=F, message=F, warning=F, out.width="100%",fig.align='center'} plot(c(-0.15,1.3),0:1,type='n',axes=FALSE,xlab = "", ylab = "") text(0.6, 0.9, 'all variables', cex = 2) rect(0.4,0.8,0.8,1) text(0.25, 0.5, 'numerical', cex = 2) rect(0.1,0.4, 0.4, 0.6) arrows(0.45, 0.78, 0.34, 0.62, length=0.08) text(0.9, 0.5, 'categorical', cex = 2) rect(0.73,0.4, 1.07, 0.6) arrows(0.76, 0.78, 0.85, 0.62, length=0.08) text(0, 0.1, 'continuous', cex = 2) rect(-0.17, 0, 0.17, 0.2) arrows(0.13, 0.38, 0.05, 0.22, length=0.08) text(0.39, 0.1, 'discrete', cex = 2) rect(0.25, 0, 0.53, 0.2) arrows(0.35, 0.38, 0.4, 0.22, length=0.08) text(0.77, 0.105, 'regular\ncategorical', col=COL[6], cex=1.5) rect(0.64, 0, 0.9, 0.2, border=COL[6]) arrows(0.82, 0.38, 0.77, 0.22, length=0.08, col=COL[6]) text(1.12, 0.1, 'ordinal', col=COL[6], cex = 2) rect(0.99, 0, 1.25, 0.2, border=COL[6]) arrows(1.02, 0.38, 1.1, 0.22, length=0.08, col=COL[6]) ``` ## Types of variables \begin{table}[] \begin{tabular}{llllll} Student & gender & sleep & bedtime & countries & dread \\ \cline{1-5} 1 & male & 5 & 12-2 & 13 & 3 \\ 2 & female & 7 & 10-12 & 7 & 2 \\ 3 & female & 5.5 & 12-2 & 1 & 4 \\ 4 & female & 7 & 12-2 & & 2 \\ 5 & female & 3 & 12-2 & 1 & 3 \\ 6 & female & 3 & 12-2 & 9 & 4 \\ \cline{1-5} \end{tabular} \end{table} - gender: \alert{Type?} ## Types of variables \begin{table}[] \begin{tabular}{llllll} Student & gender & sleep & bedtime & countries & dread \\ \cline{1-5} 1 & male & 5 & 12-2 & 13 & 3 \\ 2 & female & 7 & 10-12 & 7 & 2 \\ 3 & female & 5.5 & 12-2 & 1 & 4 \\ 4 & female & 7 & 12-2 & & 2 \\ 5 & female & 3 & 12-2 & 1 & 3 \\ 6 & female & 3 & 12-2 & 9 & 4 \\ \cline{1-5} \end{tabular} \end{table} - gender: **Categorical** ## Types of variables \begin{table}[] \begin{tabular}{llllll} Student & gender & sleep & bedtime & countries & dread \\ \cline{1-5} 1 & male & 5 & 12-2 & 13 & 3 \\ 2 & female & 7 & 10-12 & 7 & 2 \\ 3 & female & 5.5 & 12-2 & 1 & 4 \\ 4 & female & 7 & 12-2 & & 2 \\ 5 & female & 3 & 12-2 & 1 & 3 \\ 6 & female & 3 & 12-2 & 9 & 4 \\ \cline{1-5} \end{tabular} \end{table} - gender: **Categorical** - sleep: \alert{Type?} ## Types of variables \begin{table}[] \begin{tabular}{llllll} Student & gender & sleep & bedtime & countries & dread \\ \cline{1-5} 1 & male & 5 & 12-2 & 13 & 3 \\ 2 & female & 7 & 10-12 & 7 & 2 \\ 3 & female & 5.5 & 12-2 & 1 & 4 \\ 4 & female & 7 & 12-2 & & 2 \\ 5 & female & 3 & 12-2 & 1 & 3 \\ 6 & female & 3 & 12-2 & 9 & 4 \\ \cline{1-5} \end{tabular} \end{table} - gender: **Categorical** - sleep: **Numerical, Continuous** ## Types of variables \begin{table}[] \begin{tabular}{llllll} Student & gender & sleep & bedtime & countries & dread \\ \cline{1-5} 1 & male & 5 & 12-2 & 13 & 3 \\ 2 & female & 7 & 10-12 & 7 & 2 \\ 3 & female & 5.5 & 12-2 & 1 & 4 \\ 4 & female & 7 & 12-2 & & 2 \\ 5 & female & 3 & 12-2 & 1 & 3 \\ 6 & female & 3 & 12-2 & 9 & 4 \\ \cline{1-5} \end{tabular} \end{table} - gender: **Categorical** - sleep: **Numerical, Continuous** - bedtime: \alert{Type?} ## Types of variables \begin{table}[] \begin{tabular}{llllll} Student & gender & sleep & bedtime & countries & dread \\ \cline{1-5} 1 & male & 5 & 12-2 & 13 & 3 \\ 2 & female & 7 & 10-12 & 7 & 2 \\ 3 & female & 5.5 & 12-2 & 1 & 4 \\ 4 & female & 7 & 12-2 & & 2 \\ 5 & female & 3 & 12-2 & 1 & 3 \\ 6 & female & 3 & 12-2 & 9 & 4 \\ \cline{1-5} \end{tabular} \end{table} - gender: **Categorical** - sleep: **Numerical, Continuous** - bedtime: **Categorical, Ordinal** ## Types of variables \begin{table}[] \begin{tabular}{llllll} Student & gender & sleep & bedtime & countries & dread \\ \cline{1-5} 1 & male & 5 & 12-2 & 13 & 3 \\ 2 & female & 7 & 10-12 & 7 & 2 \\ 3 & female & 5.5 & 12-2 & 1 & 4 \\ 4 & female & 7 & 12-2 & & 2 \\ 5 & female & 3 & 12-2 & 1 & 3 \\ 6 & female & 3 & 12-2 & 9 & 4 \\ \cline{1-5} \end{tabular} \end{table} - gender: **Categorical** - sleep: **Numerical, Continuous** - bedtime: **Categorical, Ordinal** - countries: \alert{Type?} ## Types of variables \begin{table}[] \begin{tabular}{llllll} Student & gender & sleep & bedtime & countries & dread \\ \cline{1-5} 1 & male & 5 & 12-2 & 13 & 3 \\ 2 & female & 7 & 10-12 & 7 & 2 \\ 3 & female & 5.5 & 12-2 & 1 & 4 \\ 4 & female & 7 & 12-2 & & 2 \\ 5 & female & 3 & 12-2 & 1 & 3 \\ 6 & female & 3 & 12-2 & 9 & 4 \\ \cline{1-5} \end{tabular} \end{table} - gender: **Categorical** - sleep: **Numerical, Continuous** - bedtime: **Categorical, Ordinal** - countries: **Numerical, Discrete** ## Types of variables \begin{table}[] \begin{tabular}{llllll} Student & gender & sleep & bedtime & countries & dread \\ \cline{1-5} 1 & male & 5 & 12-2 & 13 & 3 \\ 2 & female & 7 & 10-12 & 7 & 2 \\ 3 & female & 5.5 & 12-2 & 1 & 4 \\ 4 & female & 7 & 12-2 & & 2 \\ 5 & female & 3 & 12-2 & 1 & 3 \\ 6 & female & 3 & 12-2 & 9 & 4 \\ \cline{1-5} \end{tabular} \end{table} - gender: **Categorical** - sleep: **Numerical, Continuous** - bedtime: **Categorical, Ordinal** - countries: **Numerical, Discrete** - dread: \alert{Type?} ## Types of variables \begin{table}[] \begin{tabular}{llllll} Student & gender & sleep & bedtime & countries & dread \\ \cline{1-5} 1 & male & 5 & 12-2 & 13 & 3 \\ 2 & female & 7 & 10-12 & 7 & 2 \\ 3 & female & 5.5 & 12-2 & 1 & 4 \\ 4 & female & 7 & 12-2 & & 2 \\ 5 & female & 3 & 12-2 & 1 & 3 \\ 6 & female & 3 & 12-2 & 9 & 4 \\ \cline{1-5} \end{tabular} \end{table} - gender: **Categorical** - sleep: **Numerical, Continuous** - bedtime: **Categorical, Ordinal** - countries: **Numerical, Discrete** - dread: **Categorical, Ordinal** - Could also be used as **Numerical** ## Practice \alert{What type of variable is a telephone area code?} A) Numerical, Continuous B) Numerical, Discrete C) Categorical D) Categorical, Ordinal ## Practice \alert{What type of variable is a telephone area code?} A) Numerical, Continuous B) Numerical, Discrete C) \alert{Categorical} D) Categorical, Ordinal ## Relationships among variables ```{r, echo=F, message=F, warning=F} d = read.csv("dataset/gpa_study_hours.csv") ``` \alert{Does there appear to be a relationship between GPA and number of hours students study per week?} ```{r, echo=F, message=F, warning=F, out.width="75%",fig.align='center'} plot(d$gpa ~ d$study_hours, pch = 19, col = COL[1,3], xlab = "Hours of study / week", ylab = "GPA", cex.lab = 1.5, cex.axis = 1.5, cex = 3) ``` \pause \alert{Can you spot anything unusual about any of the data points?} \pause There is one with GPA > 4.0, this is likely a data error. ## Explanatory and reponse variables - To identify the explanatory variable in a pair of variables, identify which of the two is suspected of affecting the other: \begin{align} \text{explanatory variable} \xrightarrow{\text{might affect}} \text{response variable} \end{align} - Labeling variables as explanatory and response does not guarantee the relationship between the two is actually causal, even if there is an association identified between the two variables. We use these labels only to keep track of which variable we suspect affects the other. ## Two primary types of data collection - **Observational studies**: Collect data in a way that does not directly interfere with how the data arise (e.g. surveys). - Can provide evidence of a naturally occurring association between variables, but they cannot by themselves show a causal connection. - **Experiment**: Researchers randomly assign subjects to various treatments in order to establish causal connections between the explanatory and response variables. ## Association vs. Causation - When two variables show some connection with one another, they are called **associated** variables. - Associated variables can also be called **dependent** variables and vice-versa. - If two variables are not associated, i.e. there is no evident connection between the two, then they are said to be **independent**. - In general, association does not imply causation, and causation can only be inferred from a randomized experiment. \centering 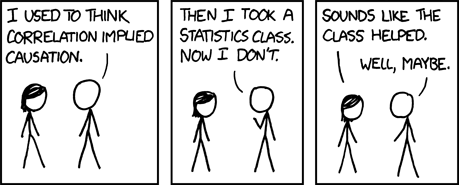{width=80%} ## Practice \begin{multicols}{2} \alert{Based on the scatterplot on the right, which of the following statements is correct about the head and skull lengths of possums?} \columnbreak ```{r, echo=F, message=F, warning=F, out.width="90%"} plot(possum$head_l, possum$skull_w, pch=20, col= COL[1], xlab = "head length (mm)", ylab = "skull width (mm)", cex.lab = 1.7, cex = 3) ``` \end{multicols} A) There is no relationships between head length and skull width, i.e. the variables are independent. B) Head length and skull width are positively associated. C) Skull width and head length are negatively associated. D) A longer head causes the skull to be wider. E) A wider skull causes the head to be longer. ## Practice \begin{multicols*}{2} \alert{Based on the scatterplot on the right, which of the following statements is correct about the head and skull lengths of possums?} \columnbreak ```{r, echo=F, message=F, warning=F, out.width="100%"} plot(possum$head_l, possum$skull_w, pch=20, col= COL[1], xlab = "head length (mm)", ylab = "skull width (mm)", cex.lab = 1.7, cex = 3) ``` \end{multicols*} A) There is no relationships between head length and skull width, i.e. the variables are independent. B) \alert{Head length and skull width are positively associated.} C) Skull width and head length are negatively associated. D) A longer head causes the skull to be wider. E) A wider skull causes the head to be longer.